You Do Not Need to Love Numbers to Use Them
If the word "analytics" makes you want to close this tab, stay with me. Spa analytics are not about spreadsheets, formulas, or finance degrees. They are about answering simple questions: Is my business growing? Where am I losing money? What should I do next? You already have instincts about your business. Analytics just confirm whether those instincts are right--and catch the gaps where they are not. SpaSphere presents your numbers in a way that feels more like a conversation than a spreadsheet.
Here is the reality. A U.S. Small Business Administration report found that businesses that regularly review financial metrics are 30% more likely to grow year over year compared to those that rely on intuition alone. You do not need to become a data analyst. You just need to look at five numbers consistently.
Analytics are not about loving numbers. They are about answering the question "is what I'm doing actually working?" with evidence instead of guesswork.
Why Spa Analytics Matter for Solo Estheticians
When you work for yourself, there is no manager handing you a performance review. No regional director flagging that your rebooking rate dropped. No accountant alerting you that your product costs are creeping up. You are the entire C-suite, and if you are not looking at the numbers, nobody is.
The average solo esthetician leaves $8,000-$15,000 per year on the table because of invisible inefficiencies--time slots that go unfilled, clients who silently lapse, services priced below their actual cost, and retail products that sit unsold. Analytics make those invisible problems visible, which is the first step to fixing them.
This is not about adding complexity to your already-full plate. It is about spending 10 minutes per week looking at numbers that prevent you from working harder for less money.
The Five Metrics That Actually Matter
You do not need to track 20 KPIs. Start with five. These cover the full picture of your spa's health without overwhelming you.
1. Revenue Per Available Hour
What it tells you: How efficiently you are using your available time.
How to calculate it: Divide your total revenue for the week by the total hours your books were open.
Example: You generated $2,800 this week. Your books were open 35 hours. Your revenue per available hour is $80.
Why it matters: This number tells you whether your problem is pricing, utilization, or both. If you are fully booked and your revenue per available hour is $80, you might need to raise prices or add higher-value services. If you have open slots, filling them is the priority. Either way, the number points you in the right direction.
Benchmark: For solo estheticians, $70-$110 per available hour is a healthy range. Below $70 usually means too many gaps in the schedule or underpriced services.
2. Client Retention Rate
What it tells you: The percentage of clients who come back within a given period.
How to calculate it: Take the number of clients who visited more than once in the past 90 days. Divide by the total number of unique clients in that period.
Example: You had 65 unique clients last quarter. Of those, 42 had at least two visits. Your retention rate is 65%.
Why it matters: Retention is the foundation of predictable revenue. A high retention rate means less money spent on marketing to replace lost clients. Our data-driven growth guide goes deeper on how retention compounds into long-term revenue, but the short version is this: every 5% improvement in retention translates to a meaningful increase in annual income.
Benchmark: 55-65% is average. 65-80% is strong. Above 80% is exceptional.
3. Average Ticket Value
What it tells you: How much the average client spends per visit, including services, add-ons, and retail.
How to calculate it: Divide your total revenue for the month by the number of appointments.
Example: You earned $5,200 from 40 appointments this month. Your average ticket is $130.
Why it matters: If your average ticket is stuck at $120 and you want to hit $6,000 per month with 40 appointments, the math does not work. You either need more appointments or a higher ticket value. Adding a $35 LED add-on or recommending a $28 serum at checkout can push your average from $120 to $155. Over 40 appointments, that is $1,400 more per month--$16,800 per year--without booking a single additional client.
Benchmark: $110-$160 is typical for solo estheticians offering facials and skincare treatments. If you are below $100, look at your add-on and retail strategy.
4. No-Show Rate
What it tells you: The percentage of booked appointments where the client did not show up and did not cancel in advance.
How to calculate it: Divide no-shows by total scheduled appointments for the month.
Example: You had 42 appointments scheduled and 3 no-shows. Your no-show rate is 7%.
Why it matters: Every no-show is lost revenue you cannot recover. At $130 per appointment, 3 no-shows per month cost you $390. Over a year, that is $4,680. Automated email reminders and deposit requirements are the two most effective tools for reducing no-shows. Our guide on reaching $50K as a solo esthetician explains how even small improvements in this number have an outsized impact on annual revenue.
Benchmark: Under 5% is excellent. 5-10% is average. Above 10% signals a need for automated reminders and deposit policies.
If you are only going to track one metric, make it revenue per available hour. It combines pricing, utilization, and no-shows into a single number that tells you how well your business is performing at the most fundamental level.
5. Rebooking Rate
What it tells you: The percentage of clients who book their next appointment before leaving or within 48 hours of their visit.
How to calculate it: Divide the number of clients who rebooked within 48 hours by the total number of appointments that week.
Example: You saw 18 clients this week. 11 rebooked before leaving or within two days. Your rebooking rate is 61%.
Why it matters: The rebooking rate is a leading indicator. Retention tells you what already happened. Rebooking tells you what is about to happen. A high rebooking rate means your calendar fills proactively instead of reactively. If this number is below 50%, your exit conversation and follow-up process need work. Our piece on AI rebooking insights covers how predictive tools can help you identify which clients are at risk of not rebooking.
Benchmark: 50-60% is solid. Above 60% is strong. Below 40% means clients are leaving without a next step.
How to Read Your Dashboard Without a Finance Degree
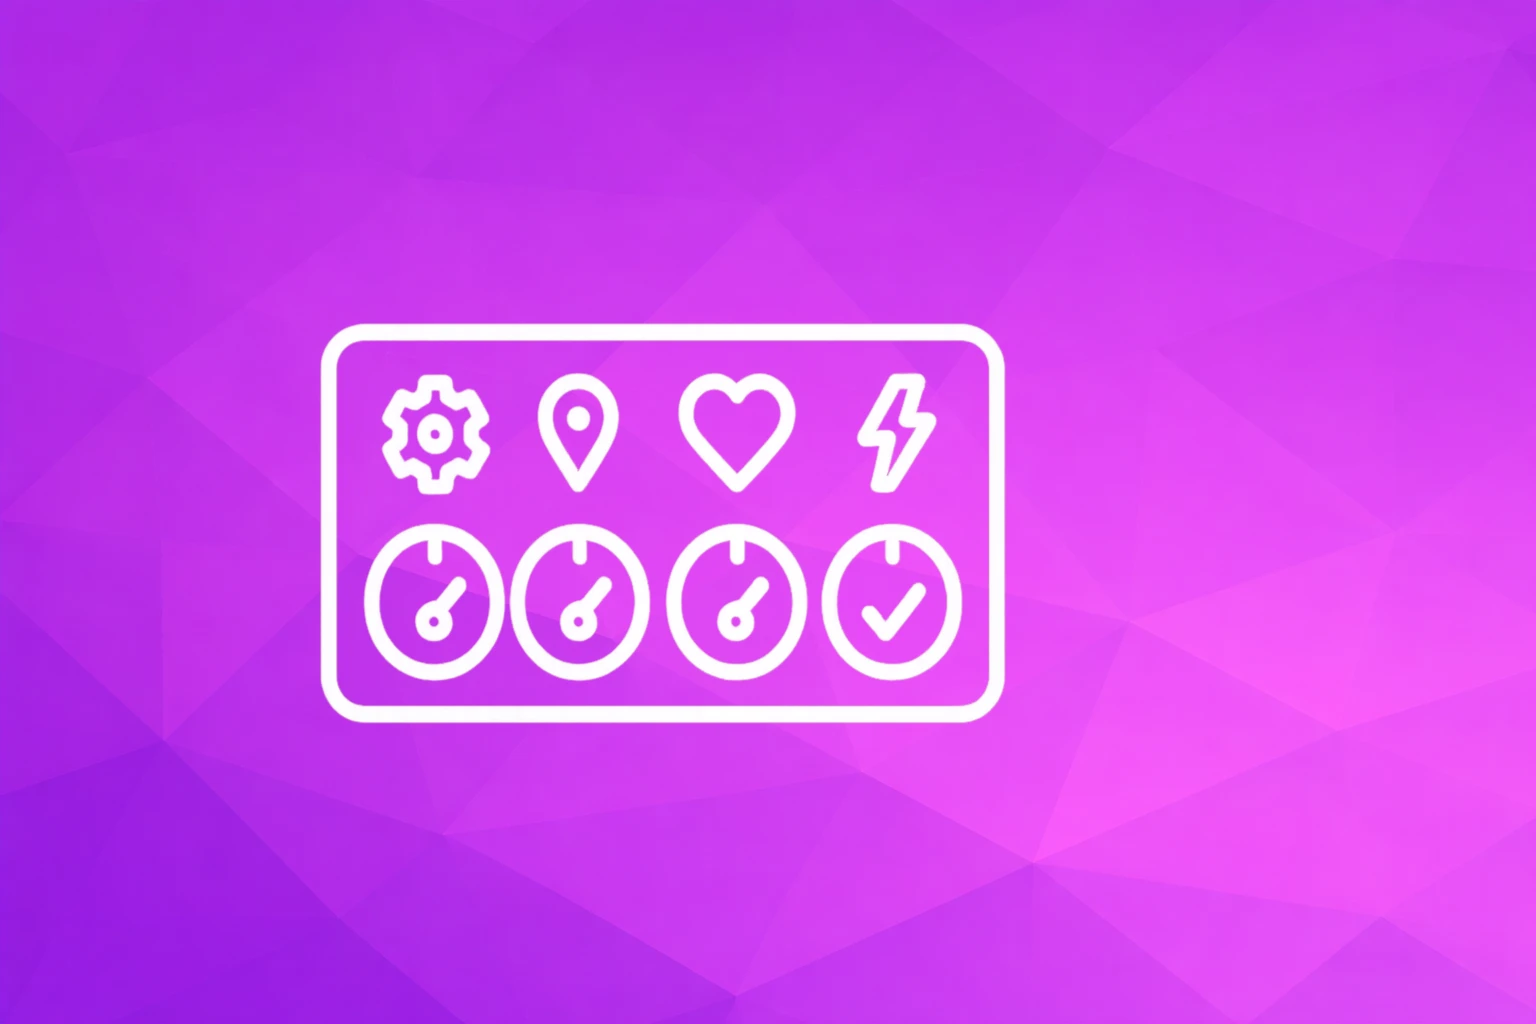
SpaSphere's Analytics Dashboard presents these metrics visually--the analytics dashboard documentation explains each panel and what it measures. But looking at a dashboard and understanding what it is telling you are two different things. Here is a simple framework for interpreting your numbers.
The Traffic Light Method
For each of your five metrics, assign a color:
- Green: The number is at or above your benchmark. No action needed this week.
- Yellow: The number is slightly below your benchmark. Monitor it and make one small adjustment.
- Red: The number is significantly below your benchmark. This is your priority for the week.
Each Monday, spend 5 minutes scanning your dashboard and assigning colors. If everything is green, you are on track. If one metric is yellow, make a note to address it. If anything is red, that is your focus for the week before anything else.
What to Do When a Number Is Red
- Revenue per available hour is low: Check your utilization first. Are there open slots you could fill? If the schedule is full but revenue is still low, your pricing or service mix needs attention.
- Retention is dropping: Look at who is leaving. New clients after one visit? Your follow-up process needs work. Long-time clients drifting away? You may need to re-engage them with a personal outreach or a treatment plan.
- Average ticket is flat: Review your add-on menu. Are you offering relevant upgrades during the service? Are you recommending retail products that complement the treatment? Sometimes a $30 add-on is all it takes.
- No-shows are climbing: Verify that automated reminders are active and sending. Consider implementing or increasing deposit requirements for first-time clients or high-value appointments.
- Rebooking is low: Revisit your exit conversation. Are you ending every appointment with a specific recommendation for the next visit? If not, that is the easiest fix available.
SpaSphere's AI Daily Brief can surface these insights automatically each morning, highlighting what changed and suggesting specific actions. You do not have to diagnose the numbers yourself--the system flags what needs attention.
You do not need to be good at math to run a data-driven spa. You need to look at five numbers once a week and ask one question: what does this tell me to do differently?
A Practical Example: How Priya Used Analytics to Find $12,000
Priya is a solo esthetician in San Diego who was earning $4,800 per month and feeling stuck. She "felt" busy but did not know if she was actually profitable. She started tracking her five core metrics and discovered three problems hiding in plain sight.
Problem 1: Low utilization. Her books were open 32 hours per week, but she was only booked for 22 hours. Revenue per available hour was $69--below the healthy threshold. Ten hours per week were going unfilled.
Problem 2: No retail strategy. Her average ticket was $118--almost entirely from services. She was not recommending products during treatments because she did not want to feel "salesy."
Problem 3: No rebooking process. Her rebooking rate was 38%. Most clients left without scheduling their next visit.
Priya made three changes:
- She blocked off her slowest 8 hours per week, reducing her available hours to 24. This increased her utilization rate and her revenue per available hour to $92.
- She started recommending one product per appointment--just the product she used during the treatment. Average ticket climbed from $118 to $141.
- She added a simple exit conversation: "I would love to see you in 4 weeks for your next session. Want me to book it now?" Rebooking rate rose from 38% to 57%.
The combined impact over 12 months: an additional $12,400 in annual revenue. She did not add a single new marketing channel, raise her prices, or work longer hours. She just looked at the numbers and made three small adjustments.
Priya did not need more clients or longer hours. She needed visibility into five metrics and the willingness to make three small changes. That is what analytics does for your business.
Common Mistakes With Spa Analytics
1. Tracking Everything at Once
There are dozens of metrics you could track. But tracking 15 KPIs is worse than tracking none because the overwhelm leads to inaction. Start with five. Once those become second nature--you know your numbers without looking--add one or two more. As our data-driven growth guide recommends, focus creates clarity.
2. Checking Numbers Without Taking Action
A dashboard is not a decoration. If you look at your retention rate every week and never do anything about it, the number serves no purpose. Every time you check a metric, ask: "What does this tell me to do?" If the answer is "nothing," the number is fine. If the answer is "something," write it down and do it this week.
3. Panicking Over a Single Bad Week
One slow week does not mean your business is failing. Analytics are useful over time, not in isolation. Look at 4-week rolling averages before making changes. A dip in retention for one week could be seasonal, coincidental, or just noise. A dip that persists for four weeks is a trend worth addressing.
4. Comparing Yourself to Industry Averages Without Context
A 70% retention rate might be excellent for a spa that opened six months ago and mediocre for one that has been running for five years. Your most useful benchmark is your own past performance. Compare this month to last month. This quarter to last quarter. Industry averages are a reference point, not a report card.
5. Ignoring Retail Metrics
Many estheticians track service revenue carefully but overlook retail. If you are not tracking your retail attachment rate (the percentage of appointments where a product is also purchased), you are missing a major revenue lever. For context, AI predictive analytics for spa clients shows how data can identify which clients are most likely to purchase products--so you can focus your recommendations where they are most likely to convert.
Step-by-Step: Setting Up Your Analytics Routine
Step 1: Define your five metrics. Use the five listed above or choose the ones most relevant to your business. Write them down and define how you will calculate each one.
Step 2: Establish your baselines. For each metric, calculate where you stand today. This is your starting point, not your standard. Do not judge the numbers--just record them.
Step 3: Set weekly check-in time. Block 10 minutes every Monday morning. Open your analytics dashboard, review each metric, and assign a green/yellow/red color. Write down one action item if anything is yellow or red.
Step 4: Set monthly review time. Block 20 minutes at the end of each month. Look at trends across the four weeks. Did your average ticket climb? Did retention hold steady? What worked, and what did you try that did not move the needle?
Step 5: Act on one red metric per week. If your rebooking rate is red, focus this week on improving your exit conversation. If your no-show rate is red, verify your reminders are active and consider adding deposits. One fix per week compounds into meaningful improvement over a quarter.
Step 6: Celebrate green metrics. When a metric is consistently green, acknowledge it. You are doing something right. Understanding what is working is just as valuable as fixing what is not.
Step 7: Revisit and adjust quarterly. Every three months, review whether the five metrics you are tracking are still the most relevant ones. As your business evolves, the numbers that matter most may shift. Add, remove, or adjust based on your current priorities.
Set a repeating calendar event for your weekly analytics check-in. Treat it like a client appointment--non-negotiable, 10 minutes, every Monday. Consistency is what turns data from a chore into a habit.
FAQ
Q: I have never tracked any metrics. Where do I start? A: Start with revenue per available hour. It is the single most useful number because it tells you whether you are pricing correctly and filling your schedule efficiently. Calculate it for the past two weeks and use that as your baseline. Then add one more metric per week until you are tracking all five.
Q: How do I track these metrics if I do not have software? A: You can start with a simple spreadsheet. Log your total revenue, number of appointments, no-shows, and rebookings each week. Calculate the five metrics manually. It takes about 15 minutes per week. When you are ready for automation, SpaSphere's Analytics Dashboard calculates everything in real time so you can skip the spreadsheet entirely.
Q: What if my numbers are bad? Should I be worried? A: Bad numbers are not a crisis. They are a diagnosis. If your retention rate is 40%, that is not a reason to panic--it is a clear signal that your follow-up process needs work. The whole point of tracking metrics is to find problems early, when they are small and fixable. A problem you can see is a problem you can solve.
Q: How long until I see results from tracking analytics? A: You will start noticing patterns within 30 days. By 60-90 days, you will have enough data to make confident decisions. The impact compounds over time. Small weekly improvements--a 2% bump in rebooking here, $8 more per average ticket there--add up to thousands of dollars per year.
Q: What is the difference between a KPI dashboard and the AI Daily Brief? A: The Analytics Dashboard shows your metrics over time with charts and trends. The AI Daily Brief is a daily summary that tells you what happened yesterday, what is coming today, and what needs your attention. Think of the dashboard as the full picture and the daily brief as the morning headline. Both are part of SpaSphere, and they work together to keep you informed without requiring you to analyze raw data.
Q: Do I really need analytics if my business is doing well? A: Especially then. When business is good, analytics help you understand why so you can replicate it. They also catch early warning signs--a slowly declining retention rate, a creeping no-show problem--before they become visible in your revenue. The best time to build a data habit is when things are going well, not when you are already in trouble.
Numbers Are Not the Point. Better Decisions Are.
Spa analytics are not about becoming a numbers person. They are about making smarter decisions in less time. Five metrics, 10 minutes per week, and the willingness to act on what the data tells you. That is the entire system. The estheticians who grow consistently are not the ones with the best marketing or the most talent. They are the ones who know their numbers and adjust accordingly.
See your spa's key metrics at a glance with SpaSphere's Analytics Dashboard.